Friday, December 31, 2010

Happy New Year!!!

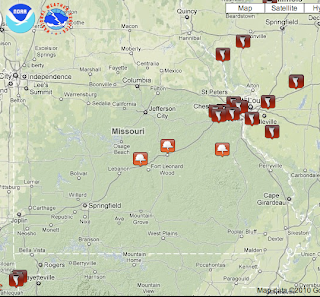
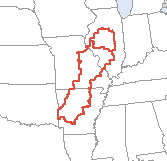
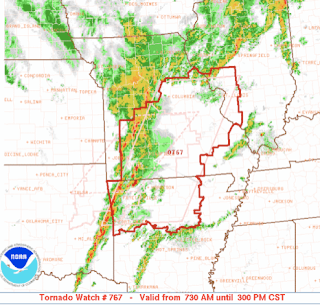
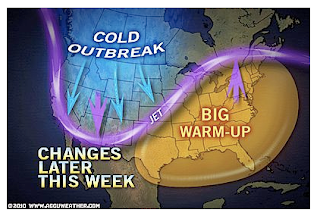
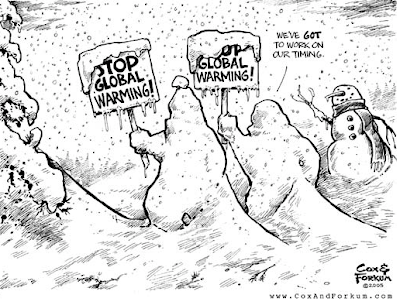
Meteorological Musings is not intended to be a real-time weather site like AccuWeather's. However, we made an exception today because of seriousness of the threat combined with the fact that people do not expect tornadoes on New Year's Eve.  I hope our readers found the coverage interesting and worthwhile.

In case you missed it, I did post Part 3 of the global cooling series.  It is here if you do not wish to wade through all of the tornado coverage.  

By the way, Harry Smith's CBS Evening News this evening mentioned that there was "just" 9 minutes of warning of the pre-dawn tornado at Cincinnati, Arkansas this morning.  I can state with near certainty that, 25 years ago, there would have been zero warning. There are eyewitness reports the tornado sirens were going off before the tornado arrived. My point in bringing this up is to illustrate how good the warning system has become. The first watch was issued about 5 hours in advance with time to take precautions (9 minutes) before the tornado arrived. 

So, congratulations to the meteorological community on another job well done and HAPPY NEW YEAR from Kim and I to all of our readers!  We are glad you found the blog and hope you enjoy it in 2011!!

A New Tornado Watch

UPDATE 4:53pm:  Here is a WeatherTap radar image of a hook echo (near the auto [spotter] symbol near Terry) moving northeast. Tornado warning for Jackson and surrounding area!

UPDATE 5:42pm: There is confirmed damage south and east of downtown Jackson.  


CNN is now reporting three fatalities in Arkansas and three in Missouri from 
tornadoes earlier today. 

UPDATE: 4:40PM Friday.  Here is the AccuWeather Radar showing tornado-warned storms west of Jackson, MS. Play close attention to the weather in these areas!!

Below, I talk about non-conventional tornado signatures in winter. Here is a supercell with a hook southwest of Jackson as recorded by NWS radar at 4:15pm:
The developing hook is circled in red. 


How Do We Track Tornadoes?

There has been a rash of tornadoes today from the Ozarks to Illinois. 
The dark red symbols are preliminary reports of tornadoes and
the small orange symbols are funnel cloud reports.
It appears there were tornadoes in the I-44 corridor
from Ft. Leonard Wood to St. Louis.
So far, we have reports of five fatalities. That is a tragic number. But, given that the tornadoes began in the pre-dawn hours (scroll down to see the first watch issued at 1:10am) when people were sleeping and that the storms hit densely populated areas well outside of "tornado season," that number is very low compared to what it would have been even 25 years ago.

Of course, Warnings: The True Story of How Science Tamed the Weather is the story of how we learned to "tame" (effectively warn of) tornadoes, hurricanes and other storms so lives could be saved. I thought I'd take this opportunity to give you a taste of how meteorologists do their work while storms are in progress. 

The tornadoes that have occurred today have had very different signatures compared with the damaging tornadoes of spring. In spring, the tornadoes that cause significant damage come from large thunderstorms known as "supercells" and the tornado signature is a "hook" echo.
Fish hook at left and a classic "hook" echo (yellow-gold color near I-80 symbol).
Today, only a few of the tornadoes were accompanied by identifiable hooks. This is fairly common with cold season tornadoes.

If you have read Warnings, you remember a chapter about a 1973 pre-Thanksgiving tornado in Oklahoma City that occurred without warning. That storm on radar looked like a candy cane. Well, take a look at this echo associated with a damaging tornado in the southwest part of the St. Louis Metro area just before noon:

The question mark or candy cane-shaped echo was moving northeast toward Pacific. The tornado at this time was near Meramec Terrace moving northeast. Because my colleagues at WeatherData knew what to look for, as a result of all of the research of the last quarter century, we were able to have warnings well in advance for our clients in the path of the storm.

But, some of the tornadoes were even more subtle. We had to turn to Doppler radar, which displays the winds inside the storm to see some of the tornadoes.
No obvious tornado in the conventional radar data.
In Warnings I describe the struggle to pry loose Terminal Doppler Weather Radar (TDWR) data from the Federal Aviation Administration. Today is an excellent example of why that was a critical battle: The image above, when the tornado was redeveloping near Fenton, had no obvious signature in the conventional radar data. But, on the FAA's Terminal Doppler Weather Radar (TDWR)
TDWR showing two tornadoes (red circles) in St. Louis County, Missouri
the major tornado (larger red circle) sticks out like a sore thumb. A weaker, but still damaging, tornado can be seen near Manchester in the smaller circle. With this technology, WeatherData's meteorologists are able to provide precision storm warnings to save lives and property.

What about the National Weather Service's NEXRAD? Because these tornadoes were so small and because of some missing data at a critical time, the TDWR was critical today! So, thank you Federal Aviation Administration!!

The National Weather Service put out effective watches and warnings for the public and WeatherData did its usual outstanding job of providing specialized warnings for businesses. The system worked the way it was designed to.  

And, if you have found this interesting, I believe you'll find Warnings fascinating. 

Tornado Threat Update, 2:20pm

We are now getting tornado warnings (red) in the southern tornado watch areas (yellow).

AccuWeather's radar shows the strong thunderstorms from central Illinois to the Gulf Coast states.

Updated AccuWeather radar is here.

Tornado Threat Update 12:45pm

Yellow - tornado watch. Red = tornado warning at 12:43pm.

I believe the threat of tornadoes will also exist in eastern Arkansas, other areas of Mississippi and western Tennessee later today.

Please stay with AccuWeather for updates.

Tornado Threat in St. Louis Update

For those of you who have read Warnings you'll recall the chapter where I talk about the November radar signature of a tornado that looked like a candy cane. Here is one right now in the southwest part of the St. Louis Metro area.  Look just east of the I-44 symbol near the center of the image (click to enlarge):

There is another area of damaging winds along the Missouri River northeast of Union. The symbol near Union indicates a radio tower was blown over.

The purple = tornado warnings which now pretty much cover all of the Bi-State area.

UPDATE:  1140am. One fatality reported in eastern Missouri. Homes reported collapsed in southwest part of St. Louis metro.

UPDATE 12:36PM.  Photo of tornado damage north side of  Rolla, MO below from the local fire department:

Out of Season Tornado Threat Update

Two tornado watches in effect:

Three fatalities and quite a bit of damage has been reported, including around Ft. Leonard Wood and Rolla, MO (likely tornado damage):

Radar at 11:05am shows tornado warning (purple) extended into western St. Louis County ahead of the line of storms:

Tornado Watch until 3pm!

UPDATE 8:55am Friday:  Extensive damage, near Westville, OK. That tornado moved northeast into the area around Cincinnati, AR causing additional damage and three fatalities.

Rare tornado threat on New Year's Eve. New tornado watch in effect until 3pm. 

This storm warning snapshot, from 7:40 am, shows the tornado watch (yellow) in Missouri and tornado warnings (red). The orange is blizzard warnings. 

AccuWeather, as always, has updates. 

Global Cooling, Part 3 of 3

We are hearing that Great Britain is experiencing the coldest December in 1,000 years.  We also know that atmospheric temperatures more or less stopped warming in 1998 and ocean heat content (the more important metric of the earth’s temperature) is steady or slightly falling.  These measurements are markedly different than the forecasts of warming made by the International Panel on Climate Change, the group cited by most global warming proponents.

As discussed in Part II, what if these indications of cooling are just that: Signs of cooling? Since many (see here and here) are advocating cooling and desire to spend tremendous sums of money to make it happen, I must ask if this is a situation where we need to be careful what we wish for.

What might be the source of the cooling? Less energy from the sun.

When I was in meteorology school, before satellites measured the sun’s output from above the earth’s atmosphere, we were incorrectly taught about “the solar constant.” That is, the sun’s output was thought to be the same year after year, in spite of astronomers observing a variety of sunspot changes over the centuries.

Some thought the number of sunspots might affect the weather but they were generally outside the mainstream of scientific thinking. 

Now, we know the sun’s output varies. Still, the IPCC has generally thought the effect of the sun’s changes on climate are minimal. 

Looks like we are about to find out whether the IPCC's hypothesis is correct. 

Below is a forecast of sunspots made by the National Oceanic and Administration in 2006.   Sunspot numbers were predicted to peak at about 150 in early 2010.  That forecast is the solid white line below. The dotted white lines indicate the “confidence interval,” that is NOAA was 95% confident the actual value would fall between the two dotted lines (i.e., a peak between 130 and 170).

The blue line is the sunspot numbers up until last month (latest available data). To put it mildly, the original forecast was wildly inaccurate.

More importantly, the previous solar cycle (the one that peaked in 2001) lasted much longer than normal and some scientists believe that, in itself, is a sign of cooling.  Other scientists believe there are connections between both cosmic rays and clouds and/or the sun’s magnetic output (which is currently at very low levels) are tied to earth’s temperatures.

To demonstrate what appears to be a strong correlation, please look at the graph of world temperatures for the last 2,000 years. 

Now, I have focused on the last 500 years of temperature data and put it next to graph of sunspot activity. There appears to be a strong correlation. 
Closeup of Temperatures the last 500 Years
The solid black line is the sunspot number. Temperatures (compare to graph above)
plummet at the Maunder Minimum with a
 secondary drop associated with the Dalton Minimum.

There are astronomers that are predicting that we are starting to experience another “Dalton Minimum.” If so, and if the correlation of sun to earth’s temperature is correct, major cooling may indeed occur.

Since a significant number of environmental groups want cooling to occur, it must be a good thing, right?  Hardly!

Here is a chart of earth’s temperatures (as measured by thermometers) since 1850.

Note the cooling that occurred from about 1945 to 1978.  This is when the MSM, and some of the same people that have been recently warning of warming, were warning of cooling.

The mid-century cooling correlated with starvation and the worst,
in terms of loss of life, hurricane in history. Click to enlarge.


When temperatures reached their nadir, world food supplies severely contracted and major starvation – involving millions of people – occurred.  
Books like The Population Bomb and Famine 1975! were written explaining that the world would have to blockade select nations and allow their populations to starve to death so that others could survive.  The Population Bomb begins,

The battle to feed humanity is over. In the 1970's the world 
will undergo famines -- hundreds of millions of people will starve to death. 
Horrible famines occurred in the 1970's but ended. Why? The unexpected warming of earth’s temperatures combined with The Green Revolution.  Warmer weather means longer growing seasons; more CO2 in the air means crops grow more efficiently, and – in some cases – crops can be grown over larger areas of the world.

Today, while there is of course starvation in the world, it is not due to absence of food. There is sufficient food today to feed everyone. But, corrupt governments and faulty distribution prevents some of it from getting to the people who need it.

But, what about the future?

Given our experiences in the late 1960’s and 1970’s – and a larger world population today – it is likely that mass starvation would again commence if temperatures were to drop to the levels of the Dalton Minimum (DM).  We simply could not grow enough food in the colder climate. In a DM scenario, the extra CO2 in the atmosphere might a form of “insurance” keeping temperatures warmer than they otherwise would be.

I have no opinion whether this will occur. As pointed out in Part II, no one has demonstrated skill in forecasting future climate. But, as a person who is a strong advocate of mitigating  risks, we cannot focus solely on the risk posed by global warming when the apparent consequences of significant cooling are far more serious. 

The bottom line: As my friend Dr. Roger Pielke, Jr., says, we need to build a more resilient society to extremes of weather – regardless of what those extremes might be. 

Thursday, December 30, 2010

Why Are We Doing This to Ourselves??!!

Until recently, California’s Central Valley was one of the nation’s most productive agricultural regions.  Not only did it feed itself, the state of California, and the entire country, it also produced exports to other nations.  That kind of enterprise employed a lot of people in Central California, from farm hands to wholesalers, and created a high standard of living.
That continued right up to the moment that the federal government got more concerned over the Delta smelt, a small, inedible fish, than feeding people.  A court order cut off water deliveries for seven months out of the year to the Central Valley at the same time a drought hit, and the combination turned a once-fertile breadbasket to the world into a Dust Bowl — or as Investors Business Daily suggests, a government-initiated agricultural disaster on the same order as Zimbabwe today or Ukraine in the 1930s. 

This is an amazing, tragic, and cautionary tale of environmentalism gone madWhy are we doing this to ourselves?!

Hat tip: hotair.com

Coming Soon to the Blog

As I read about the hundreds of flights cancelled again today and the thousands still stranded (in some cases, until Jan. 4), I'm going to write up an "airline survival guide" and post it later this week.

You'll laugh, you'll cry...but if you follow this advice you will not get yourself into one of these situations ever again!

Stay tuned.

Global Cooling, Part 2 of 3

Among many in the climate science community, global warming is a given. There is no consideration given to the earth losing heat and cooling.

But is the chance of cooling really zero?  And, if it is not zero, what might the implications of cooling be? This is Part 2 of a three-part essay on global cooling. Part 1 is below.

Lets examine whether the “consensus” regarding continued warming is well-founded. 


World history is made up of cooling periods and warming periods. Here is a graph of temperatures for the last 2,000 years:
The Roman Warm Period was in progress at the time of Christ. Temperatures plummeted a few centuries later. Rome fell as civilizations relocated to escape the cold.

Temperatures warmed again about a thousand years ago. During the Medieval Warm Period, wine grapes were grown in Newfoundland and Leif Ericson set up a settlement in Greenland (which he described as “green”).  Over the next few centuries, temperatures dropped so much that the glaciers advanced and the world experienced the Little Ice Age. Temperatures have been in recovery mode since.

It is very likely that humans have influenced temperatures and other aspects of climate, especially in the past few decades as fossil fuel use has increased. Because of solar activity, volcanoes, cosmic rays, and climate feedbacks (i.e., other factors equal warmer temperatures equal more clouds which should produce cooling) it is impossible, at the present state of the science, to know the exact extent of man’s influence.

Climate scientists attempt to investigate the extent of man’s influence through the use of climate models. The models are complex computer simulations of the atmosphere, the ocean, the sun, and demographic trends.  The value of these simulations is limited because, to cite just one example, we don’t understand the role of clouds and tiny dust particles in regulating incoming solar radiation and outgoing “long wave” radiation. With so much about the sun, cosmic rays, and other influences not understood, the models cannot be relied upon to make accurate forecasts (see Part 1 for examples of wildly incorrect climate forecasts). In fact, the models are so unreliable, we do not use them to make 90-day climate forecasts. How can we believe they can make accurate 90-year forecasts?

It is not just my opinion that the forecasts are unreliable.  You can download a 2007 paper from The Wharton School that concludes, “We have been unable to identify any scientific forecasts to support global warming. Claims the earth will get warmer have no more credence than saying it will get colder.”

Mainstream climate scientists are starting to agree. Within the last week, Dr. Roger Pielke, Sr. writes:

There is no evidence that the global climate model multi-decadal predictions (and even shorter term runs on a year or less into the future) have the needed skill. [to make accurate forecasts]

My conclusion: There is no demonstrable skill at forecasting climate. 

With that background, lets ask a question:  What if all of the recent evidence of colder weather means just that:  The earth is starting to cool.

Now, I want to clearly state: I don’t know whether the earth’s heat content will increase, decrease, or stay the same in future decades. Neither does anyone else.

As a risk management professional, I’m asking whether major cooling or warming is the greater threat and should we prepare for either? 

I’ll offer some thoughts tomorrow.


UPDATE: New Year's Eve. Here is an article about botched environmental forecasts

Wednesday, December 29, 2010

Holiday Return Travel

Here is AccuWeather's latest forecast of ice (red) and snow:

Here is the National Weather Service's map. Important note: Orange = blizzard warnings. 
Its a festival of colors signifying the variety of weather warnings.  Generally, west of the Utah-Colorado border, the advisories apply to tonight and Thursday. East, the advisories apply to Thursday night and Friday.

Global Cooling, Part 1 of 3

I dislike the whole topic of ‘global warming’ (a/k/a ‘climate change’). I believe it has corrupted the science I love and is influencing decisions in a manner that are hurting people and economies.

Why do I write about it? Out of a sense of obligation.  There are so many tens of billions of dollars being spent, treaties negotiated, and changes to our economic system proposed, it is important to have another source of information than the mainstream media (MSM). For reasons I have never been able to understand, the MSM’s reporting on this issue has been more biased than on any other topic I can recall.

With the U.S. and Europe suffering from cold and snow and Australia reporting snow (in summer!) one would think that global warming promoters would take a moment for self-reflection. After all, things meteorological are hardly working out as predicted. Instead, we have been treated to numerous cooling = global warming stories the past week, one of which has the science so wrong one wonders who is really writing them.

Just a few of the recent headlines equating cooling to global warming. 

Belief in global warming, in spite of overwhelming evidence that the climate is more complex and more difficult to understand than many believed even a decade ago, has evolved into a classic “closed system:”

A closed system has three peculiarities. Firstly, it claims to represent a truth of universal validity, capable of explaining all phenomena, and to have a cure for all that ails man. In the second place, it is a system which cannot be refuted by evidence, because all potentially damaging data are automatically processed and reinterpreted to make them fit the expected pattern. The processing is done by sophisticated methods of causistry, centered on axioms of great emotive power, and indifferent to the rules of common logic; it is a kind of Wonderland croquet, played with mobile hoops. In the third place, it is a system which invalidates criticism by shifting the argument to the subjective motivation of the critic,...  [emphasis mine]

Examples?

1988, Dr. James Hansen of NASA predicts that, 20 years, NYC’s West Side Highway would be under water. And there will be tape across the windows across the street because of high winds.

Kim and I spent four days in NYC for the book tour in May, 21 years after Dr. Hansen made his prediction. We can assure you that NYC is not flooded nor is there tape across the windows of any buildings we saw.

2001: [In Great Britain] “Snow has become a thing of the past.”

Two record winters in a row choking transportation and causing energy rationing.


2005:  Hurricanes will get worse due to global warming.  

Hurricane activity is near historic lows.

2007: The IPCC predicted, with 95% confidence, that world temperatures would be at least 1.0° above normal by now. 

Right now, the global temperature is 0.4° above normal and, for the past year, about 0.5° above normal (HADCrut data). Temperatures have been falling the last few months and are likely to continue doing so.

Of course, these inconvenient truths are reinterpreted to support global warming as in the headlines above.

Einstein once said that, in science, make everything as "simple as possible." What if the explanation of the colder weather is the simple one: A cooling climate? And, what might the implications of a colder climate be?

Of course, some people are hoping for just an outcome.  Good idea?

We’ll examine whether global cooling is a possibility and its implications of global cooling in Parts II and III tomorrow and Friday. 

Western Winter Storm


There is a vast array of winter weather watches and warnings in the western half of the United States as a strong storm moves across the region between now and New Year's Day.

The gray in Kansas is a dense fog advisory. This is what it looked like on the way into work.

Tuesday, December 28, 2010

This is Why You Don't Fly into Major Winter Storms

Ten hours on the tarmac, after landing. Two other flights sat for eight hours each.

Rockies, Plains, and Foothills Snowstorm

Looks like 2010 is going to end on a snowy note in the Rockies and the northern half of the Plains.  We'll have more information tomorrow.

A 30-Day Rainfall Snapshot


This is a map of precipitation across the contiguous United States the last 30 days. The West is quite wet as is the northern Plains.  The recent snowstorm in the East helped with dry conditions in a number of areas.

From Kansas to the Rio Grande Valley it is extremely dry with little or no rainfall the last 30 days.

Bradley Beach, NJ Two Days Later

From AccuWeather's Facebook page:
Photographer Scott Miller reports that after two days the plows cannot get to them in Bradley Beach, NJ and that it may be worse in some neighboring counties. Check out his photography here.

The media has been so focused on Metro NYC and Boston that I do not believe they realize the full magnitude of the situation.

UPDATE:  Fifteen minutes ago from the New York Times:


Steven Gomez of Garfield, N.J., had been at the airport since 4 p.m. on Sunday for a flight to Chicago. “Now they’re telling me my flight is on the 30th,” he said. The trouble for airlines lies in finding new flights for delayed passengers. Airlines were running at record levels of capacity even before Sunday’s storm blanketed the city with 20 inches of snow during one of the busiest travel periods of the year. Through the first nine months of the year, domestic flights were fuller than at any similar period since the Department of Transportation began tracking.
With airlines flying fights so full, finding available space on new flights into and out of New York’s airports for nearly two day’s worth of passengers could take the better part of the next week.
“Flights are going out at a much slower pace than normal and there are crew availability issues as well,” said Allison Steinberg, a spokeswoman for JetBlue Airways. “Our goal is to resume as normal as possible by tomorrow. We’re doing all that we can.”
At this moment, average delays at Newark are 5+ hours and JFK 4+ hours. American Eagle's flights at LaGuardia cannot get to their gates and they have temporarily stopped takeoffs to LGA.

If you are stuck at one of the NYC airports, my suggestion: Take Amtrak home or go south on Amtrak or bus to Baltimore or D.C. where the snow is cleared and flights are operating more or less normally if the airline can give you a confirmed (in writing!) reservation and allows you plenty of time to get south. 

Change in Weather Pattern

AccuWeather's map illustrates the change in weather pattern expected late this week.
Where the cold air and warm air meet -- in the central U.S. -- a storm is going to develop. However, the path is quite uncertain. Stay tuned!

In the meantime, storm warnings are out for many areas of the West.

Monday, December 27, 2010

Timing is Everything

Of course, The New York Times ran a convoluted opinion piece*, "Bundle Up, Its Global Warming," Sunday (as the blizzard was moving in) that stated that global warming was causing cooling.

I'm working on a global cooling piece that will run later this week.

* At least one atmospheric scientist thinks the author was kidding and put one over on the Times.


UPDATE Tuesday.  Here is what a third atmospheric scientist thinks of the Times' piece.

Airport Update

Following airports still closed, expected to reopen at 6:30pm Central time: JFK, Newark, Atlantic City.  There are average 1 hour 10 minute delays at Philadelphia and average delays of 65 minutes at Washington - Dulles.

Too Close Lightning Stroke

After all of the news about the "thundersnow" in NYC last night (lightning and thunder accompanying heavy snow), I thought it would be of interest to post this "too close" cloud-to-ground lightning strike from last week in Australia (where it is summer).

Hat tip: Chris Collura

Wow!

From my colleagues at AccuWeather, a photo from Bradley Beach, NJ. Thirty inches of snow with 4-5 ft. drifts. Note the drifts up onto porches and the buried cars.

Join their Facebook page to see more.

Speaking of "wow," here is a time-lapse of 20" of snow falling. Thanks to blog reader Keith!

Heavy Snow ≠ Global Warming

You may have seen one of the recent articles that claims the recent periods of extreme cold and snow in Europe and Australia (even though it is summer there) are due to 'global warming.' Roger Pielke, Sr., answers those claims.

Updated Mike Smith Enterprises Web Page

We recently updated our web page. If you haven't been there recently, Kim and I invite you to check it out.

Sunday, December 26, 2010

Thank You, Bengals!!

The Kansas City Chiefs are the AFC West Champions thanks to a great game against Tennessee today and the Bengals upsetting the Chargers. Today was the first time I got to see "The New Arrowhead" and it is very impressive. Congrats, Chiefs!


I was at the very last game at the old Municipal Stadium when the Chiefs played the Dolphins in the longest game in NFL history. It was Christmas Day 29 years ago. The outcome was not as wonderful as today's; the Dolphins won in six periods after the Chiefs gave up several opportunities to win the game and make their second straight run at the Super Bowl. The Chiefs moved to Arrowhead the following season. It is amazing how far stadiums have come since the drafty mess that was Municipal Stadium.

Global Warming, Is There Anything It Cannot Do?

We haven't checked in for a while with Dr. John Brignell and his list of maladies associated with 'global warming.' The number is above 600 and continues to grow.

Ann Althouse had a great quote related to this the other day,

When everything is evidence of the thing you want to believe, it might be time to stop pretending you're all about science.


Hat Tip:  Edd Driscoll

Coming Up on The Blog This Week

I will have an illustrated posting on why we should be paying attention to the possibility of global cooling.  I think you'll find it very interesting.

OK Team, You Know What To Do With Those Gift Cards!


Warnings is a story about the worst storms of our lifetimes, from Category 5 hurricanes to F-5 tornadoes, and how lives were saved. A sample chapter is here. Greenleaf Book Group, the publisher, did a great job putting the book together with lots of both black and white and color photos.
One page of "Warnings'" color insert
So get out those gift cards! Here are the links...
Amazon.
Barnes and Noble.
Borders.
Watermark Books.

9am Blizzard Update

The snow continues to move north and has reached Washington, Baltimore, Philadelphia, Long Island, and Boston. Delays of 15 minutes are reported at BWI and 30 minutes at White Plains. Its downhill from here as the storm intensifies. In NYC, winds of 40 to 60 mph are expected with more than a foot of snow. Here is the 8:51 am AccuWeather radar:

This is my last update on the storm but AccuWeather will continue to update as the storm unfolds.

7am Sunday Blizzard Update

The snow has made it as far north as Richmond. The snow will continue to spread northeast as the day unfolds.

Pink = winter storm warning. Orange (including NYC, Providence and Boston) = blizzard warning.

AccuWeather has updates.

Saturday, December 25, 2010

If You Need a Sugar Rush

If the holiday excitement is past and you are dragging a little, Kim and I can recommend a place where you can get a sugar rush on the way home.