
How Did the Forecasts Work Out?
When I make forecasts that are greatly different from others', I hold myself accountable by publishing a post-storm evaluation... for better or worse. Here are two evaluations from Friday's storms now that we have the data.
Central Plains Snow
Early and late-season snow forecasting is extremely difficult, but people need to know it is coming. So, I wanted to review my snow forecast because other forecasters (NWS, AccuWeather, etc.) did not have snow in the forecast outside of northwest Kansas.
Below is the actual snow accumulation.

 |
| Satellite View of Accumulated Snow |
You can compare my forecasts (below) to the actual (above).
12:05pm Wednesday

9:30pm Thursday

9:51am Friday

4:18pm Friday
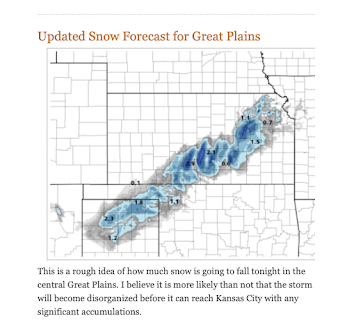 Above was the output from the HRRR model and it fit my conception of the location of the snow almost perfectly and I explained that it was going to be very difficult to forecast amounts due to the warm ground.

Because the final two forecasts improved as the event neared and because the final two forecasts -- the first more than 24-hours in advance of the snow -- were quite good, I grade myself for the three later central Plains snow forecasts: A-
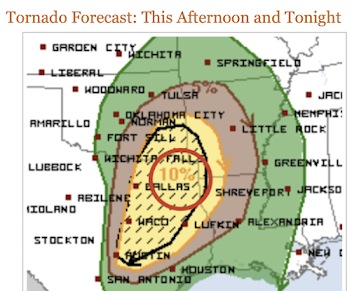 Note that the red extended into far SE Oklahoma, far SW Arkansas and far NW Louisiana as well as much of northeast Texas.
Annotated Tornado Forecast - High Risk Added
There is social science research that informs meteorologists that if people get confused in tornado situations, they will not properly respond. So, I usually use the NWS Storm Prediction Center's forecasts because I wish to avoid that confusion, unless I strongly believe there is an issue with that forecast.
By Thursday evening I was becoming convinced by data and by models that there would be an area of high risk on my 4-level scale of tornado risk. That area would be centered in far northeast Texas. So, I added a high risk area as a red oval. The wording of the forecast was, "high risk, strong tornadoes possible."
10:48pm Thursday High Risk Addition

9:08am Friday High Risk Addition
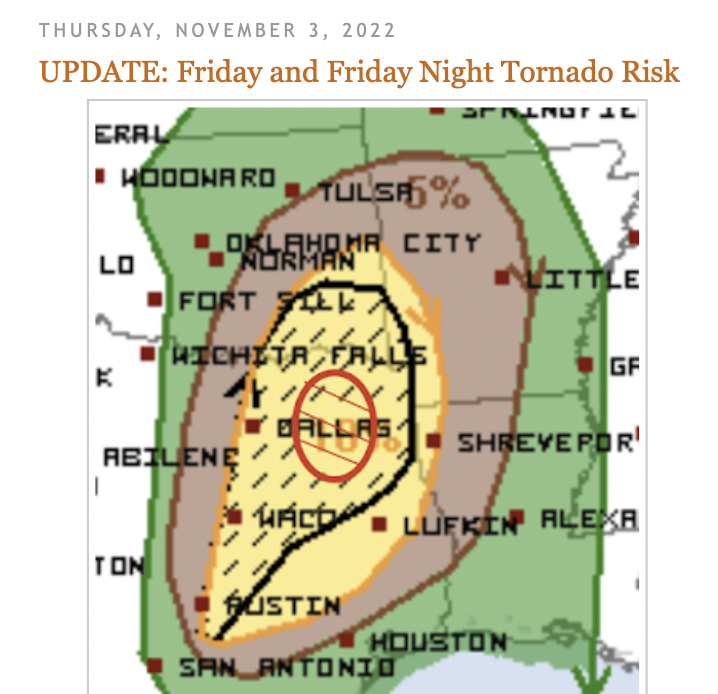
I was quite surprised the NWS did not add a red area to their forecast on either their midnight or 8am tornado forecasts. So, I added mine -- and expanded the area a bit -- at 9:08.

I did not have to add any additional high risk areas with later NWS forecasts as they added their area at 11:30am.
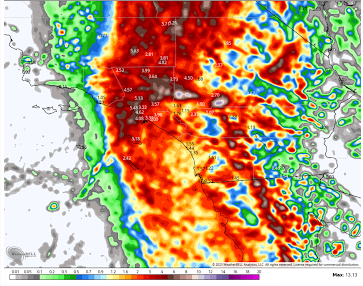
What Actually Happened?

The map above corresponds to a perfect forecast and the colors are the same as the forecasts'. Dots represent the location of tornadoes. The SPC forecast extended too far to the southwest where no tornadoes occurred.
There are two aspects of my addition to rate:
- √ The tornadoes in my red areas were "strong" (EF-2 or stronger). The fatal tornado that struck Idabel OK appears to have been a violent storm.
- √ The actual red area is nearly a perfect correspondence to the 9:08am red circle.
The rating for this forecast is A.
As longtime readers know, I do not hesitate to give myself poor grades. I was fortunate in that this was a "well behaved" storm.
UPDATE, Monday, 6:30pm
We have a final update on the tornado probability map and the final red area has been elongated a bit to the northeast. While my forecast is still an "A," the NWS SPC's "red" forecast as of 11:30am Friday would also be an A and slightly better than mine.

UPDATE: November 9


The detailed tornado path surveys are in and there was an EF-4 in extreme northeast Texas and southeast #Oklahoma. With this event as a whole there were three fatalities.
As the topic of this post is the quality of the forecast, these occurred in my red circle/oval. If anything, the probability should probably have been 30% (violent) rather than 15% red.
Comments
Post a Comment