
Want to See Turbulence on Radar?
We are all used to looking at weather radar displays of reflectivity (radar's energy being scattered by precipitation) on television like the one below. It is of the Indianapolis NWS radar at 2pm EST.

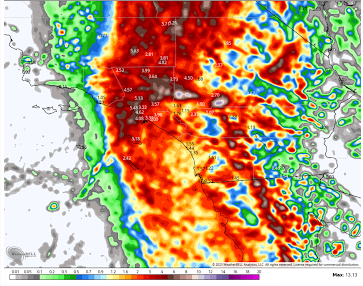
Below is a radar image of a type you've never seen before. It is from the same radar using a type of data known as "spectrum width" which correlates well to turbulence aloft (the radar was pointed up when we grabbed this image). I've circled two areas of especially turbulent air.
%2B2pm%2BEST%2BDecember%2B24%2C%2B2014%2BChristmas%2BEve.png) Turbulence often takes a "wave" or banded form and you can certainly see that over southern Indiana with more diffuse turbulence over the northern part of the state. These images were from the same time and you can note that there is not much of a correlation between the turbulence and the intensity of the reflectivity data.
Turbulence often takes a "wave" or banded form and you can certainly see that over southern Indiana with more diffuse turbulence over the northern part of the state. These images were from the same time and you can note that there is not much of a correlation between the turbulence and the intensity of the reflectivity data.
The turbulence data was captured from AccuWeather Enterprise Solutions' SmartWARN® system which is a workstation used exclusively by our meteorologists to create storm warnings and forecasts for our clients. It is much more sophisticated than any other meteorological workstation I have seen which partially accounts for the high level of accuracy in our storm warnings.
ADDITION: Confirming the disturbed air over the Hoosier State, at 2:08pm EST, a business jet urgently reported "moderate to severe chop" at 21,000 ft. south of Muncie, Indiana.


Below is a radar image of a type you've never seen before. It is from the same radar using a type of data known as "spectrum width" which correlates well to turbulence aloft (the radar was pointed up when we grabbed this image). I've circled two areas of especially turbulent air.
The turbulence data was captured from AccuWeather Enterprise Solutions' SmartWARN® system which is a workstation used exclusively by our meteorologists to create storm warnings and forecasts for our clients. It is much more sophisticated than any other meteorological workstation I have seen which partially accounts for the high level of accuracy in our storm warnings.
ADDITION: Confirming the disturbed air over the Hoosier State, at 2:08pm EST, a business jet urgently reported "moderate to severe chop" at 21,000 ft. south of Muncie, Indiana.
Posted on Twitter:
Be still my heart.
ReplyDeleteGreat to see some love for the oft-neglected third moment of Doppler analysis.
Thank you Mike.
James Aydelott,
Tulsa
Thanks, James. Merry Christmas to you and yours!!
ReplyDelete